
An AC PT chart, or refrigerant pressure-temperature chart, becomes useful when you understand what its pressure and temperature values actually represent.
A PT chart does not tell you one universal “normal pressure” for an air conditioner. Instead, it shows the relationship between a refrigerant’s saturation pressure and saturation temperature.
HVAC/R technicians use that relationship to convert a measured pressure into saturation temperature and then combine it with actual pipe-temperature measurements to calculate superheat or subcooling.
The basic workflow is simple:
- Identify the exact refrigerant.
- Measure refrigerant pressure.
- Convert pressure to saturation temperature.
- Measure the actual refrigerant-line temperature.
- Calculate superheat or subcooling.
- Compare the result with the equipment manufacturer’s service data.
For refrigerant blends with meaningful temperature glide, there is one additional rule:
Superheat → use dew point / saturated vapor
Subcooling → use bubble point / saturated liquid
If you already know the refrigerant and simply need to look up a pressure or saturation temperature, use the Refrigerants.net Pressure-Temperature Chart Tool. This guide focuses on how to interpret and use PT data rather than duplicating the tool’s full refrigerant database.
What Is an AC PT Chart?
PT stands for pressure-temperature.
At saturation, every refrigerant has a defined relationship between pressure and temperature. If saturation pressure changes, saturation temperature changes with it.
This relationship is fundamental to the vapor-compression refrigeration cycle.
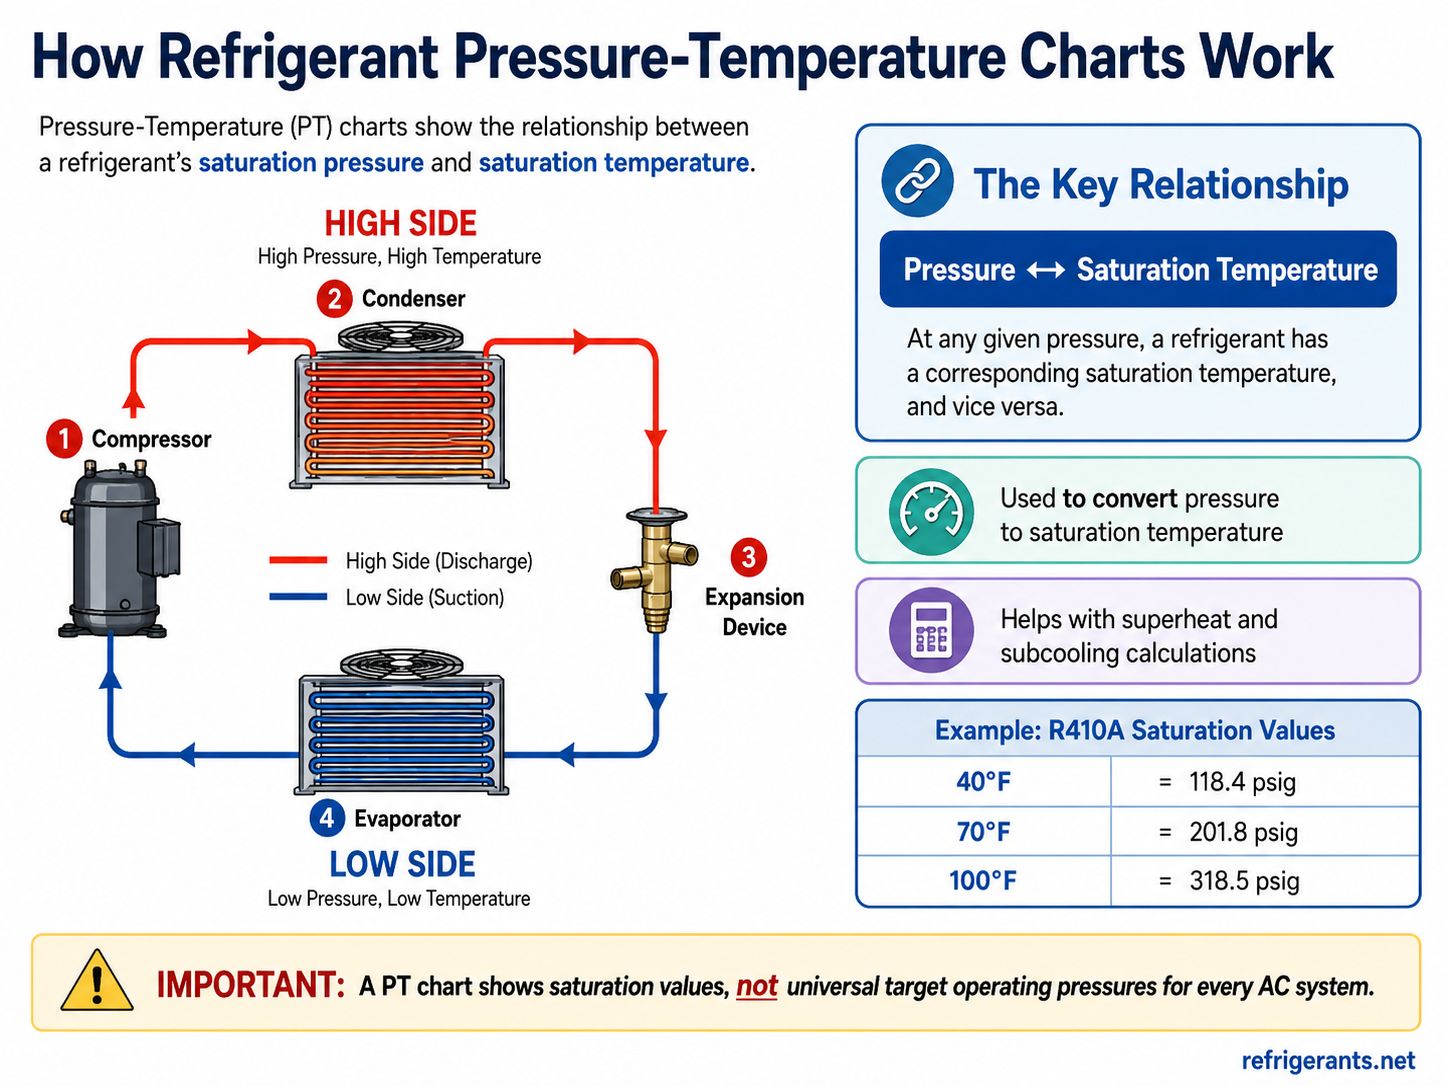
In a typical air-conditioning system:
- The evaporator operates at a relatively low pressure so refrigerant can evaporate at a low temperature and absorb heat.
- The compressor raises the pressure of the refrigerant vapor.
- The condenser operates at a higher pressure so refrigerant can reject heat and condense.
- The expansion device reduces pressure before refrigerant returns to the evaporator.
This means a pressure gauge is not simply displaying an arbitrary HVAC number. That pressure can be converted into the temperature at which the refrigerant would be saturated at that condition.
Simple Definition
An AC PT chart is a reference that converts refrigerant saturation pressure into saturation temperature, or saturation temperature into saturation pressure.
That definition is important because saturation temperature is not necessarily the same as:
- outdoor air temperature;
- indoor air temperature;
- suction-line temperature;
- liquid-line temperature; or
- discharge-line temperature.
These measurements describe different parts of the HVAC system.
PT Chart vs Normal AC Operating Pressure
One of the most common misunderstandings surrounding AC pressure charts is treating saturation pressure as a universal operating-pressure specification.
They are not the same thing.
| PT Chart | Actual AC Operating Pressure |
|---|---|
| Shows refrigerant saturation properties | Shows conditions in a running system |
| Links saturation pressure and temperature | Includes measured suction and discharge pressures |
| Primarily determined by refrigerant properties | Changes with load, airflow, ambient conditions and system design |
| Used for superheat and subcooling calculations | Used as one part of system diagnosis |
| Does not define correct refrigerant charge | Must be interpreted using OEM service information |
For example, suppose an R410A PT reference shows that a particular pressure corresponds to approximately 40°F saturation temperature.
That does not mean:
Every R410A air conditioner should always operate at that suction pressure.
It only means:
At that pressure, R410A has a saturation temperature of approximately 40°F.
Actual suction pressure depends on what evaporating condition the system is operating at.
This distinction is important when searching for terms such as:
- AC pressure chart
- normal AC pressure
- refrigerant pressure at 90°F
- R410A pressure chart
- low-side AC pressure
A PT chart is a thermodynamic reference, not a universal diagnostic target.
How to Read an AC PT Chart
There are two basic ways to use a refrigerant PT chart.
Temperature to Pressure
If saturation temperature is known, locate that temperature and read the corresponding saturation pressure.
This can be useful when comparing different refrigerants or estimating the pressure associated with a known evaporating or condensing saturation condition.
Pressure to Temperature
This direction is especially useful during service work.
A technician measures refrigerant pressure and then uses the PT relationship to determine the corresponding saturation temperature.
That saturation temperature can then be compared with an actual pipe temperature.
This is the basis of superheat and subcooling calculations.
The Refrigerant Pressure-Temperature Chart Tool supports both:
- Temperature → Pressure
- Pressure → Temperature
It also separates bubble and dew references for refrigerant blends where that distinction matters.
Step 1: Identify the Exact Refrigerant
Never interpret HVAC pressure before identifying the refrigerant.
Different refrigerants can have very different saturation pressures at the same temperature.
For example:
- R22
- R410A
- R32
- R454B
- R134a
do not share one common pressure-temperature relationship.
A pressure reading that makes sense for one refrigerant can represent a completely different saturation condition for another.
Check the:
- equipment nameplate;
- manufacturer documentation;
- refrigerant label;
- service records; and
- approved equipment specification
before selecting a PT chart.
You can also review the individual refrigerant guides for R410A, R32 and R454B if you need information beyond PT data.
Step 2: Identify the Side of the Refrigeration System
In a conventional vapor-compression AC system, pressure measurements are commonly considered in terms of the low side and high side.
Low Side
The low side is associated primarily with the evaporating portion of the system.
Low-side pressure can be converted into evaporating saturation temperature and used as part of a superheat calculation.
High Side
The high side is associated primarily with the condensing portion of the system.
High-side pressure can be converted into condensing saturation temperature and used as part of a subcooling calculation.
The pressure itself does not equal superheat or subcooling.
You need an actual pipe-temperature measurement as well.
Step 3: Measure Refrigerant Pressure
Use service equipment suitable for the refrigerant, pressure range and system being serviced.
The pressure measurement must use units compatible with the PT reference.
Common pressure units include:
- psig
- psia
- bar(g)
- bar(a)
- kPa(g)
- kPa(a)
PSIG vs PSIA
This distinction can cause significant errors.
PSIG is gauge pressure referenced to atmospheric pressure.
PSIA is absolute pressure referenced to a vacuum.
At standard sea-level atmospheric pressure:
PSIA ≈ PSIG + 14.7 psi
However, atmospheric pressure changes with elevation and weather conditions.
Your pressure unit and PT dataset should therefore always be clearly identified.
Step 4: Convert Pressure to Saturation Temperature
Once pressure is measured, use the correct refrigerant PT reference to convert that pressure into saturation temperature.
For example, imagine an R410A suction-pressure measurement that corresponds to approximately:
40°F saturation temperature
You now know the theoretical saturation temperature of the refrigerant at that pressure.
But you still do not know the amount of superheat.
For that, you need an actual suction-line temperature.
Step 5: Measure the Actual Line Temperature
A suitable pipe-clamp temperature probe is commonly used to measure refrigerant-line temperature.
For superheat, this is typically a suction-line temperature measurement.
For subcooling, this is typically a liquid-line temperature measurement.
You now have two different temperatures:
Saturation temperature derived from pressure
and
Actual measured line temperature
The difference between those values gives superheat or subcooling.
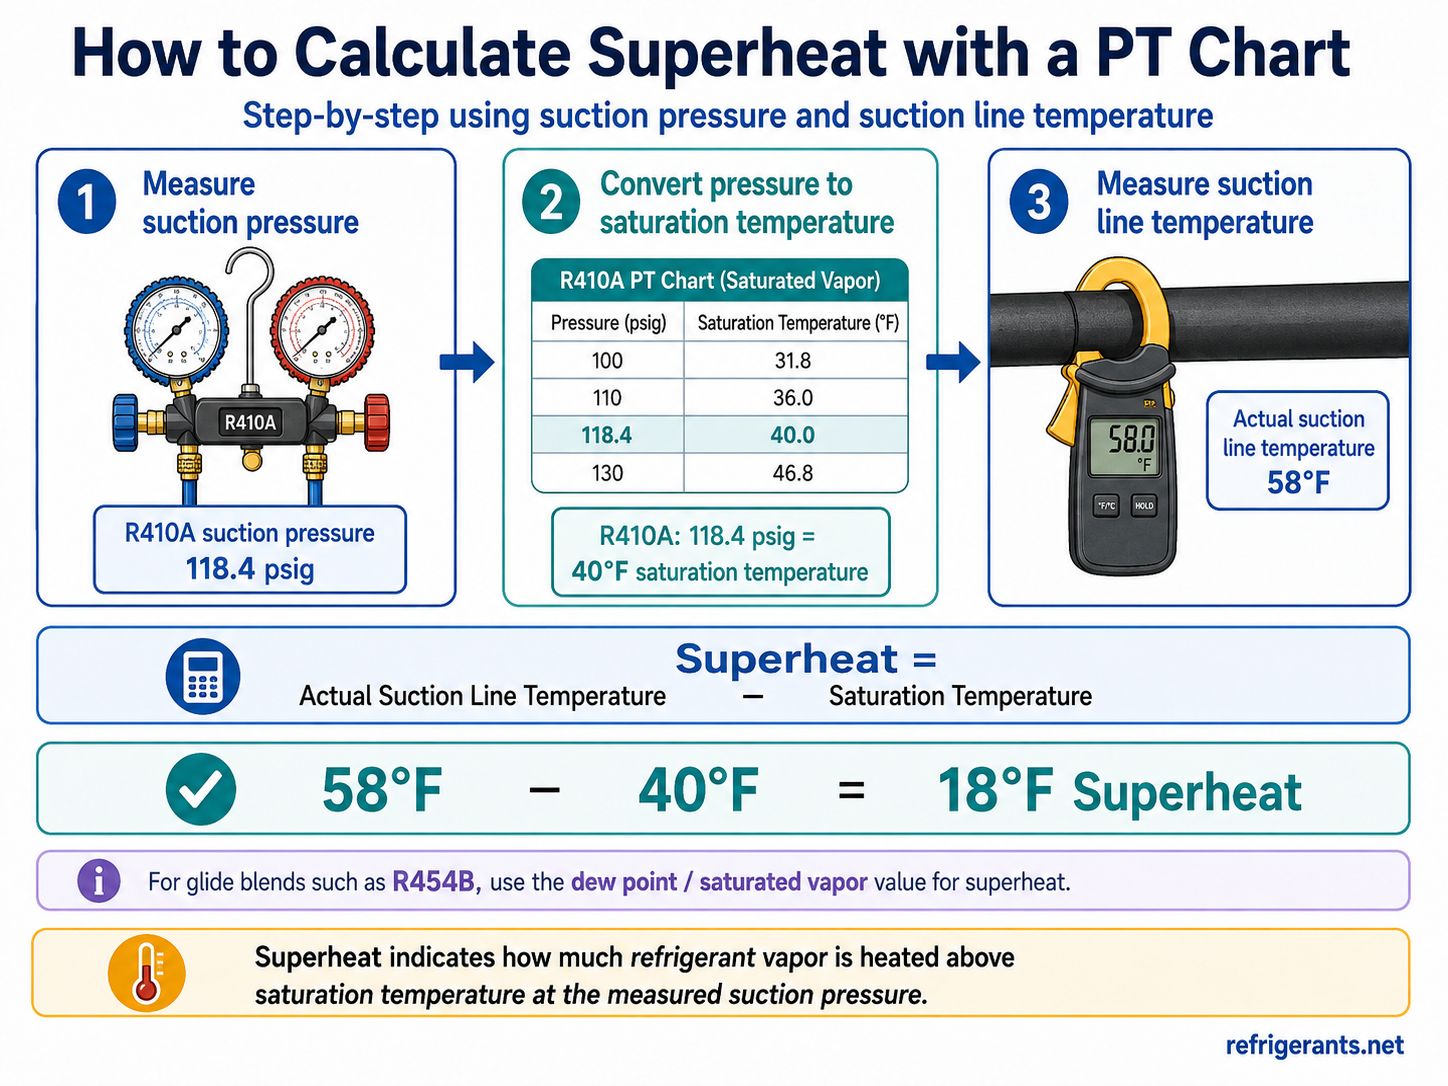
How to Calculate Superheat with a PT Chart
Superheat describes how far refrigerant vapor has been heated above its saturation temperature at the measured pressure.
The formula is:
Superheat = Actual Suction Line Temperature − Saturation Temperature
Superheat Example
Suppose an R410A system has a suction pressure that corresponds to approximately:
40°F saturation temperature
The measured suction-line temperature is:
58°F
The calculation is:
58°F − 40°F = 18°F superheat
The refrigerant vapor at the measurement location is therefore approximately 18°F above its saturation temperature.
What Does Superheat Tell You?
Superheat helps confirm that refrigerant leaving the evaporator has become vapor and provides useful information about evaporator feeding and system operation.
However:
18°F superheat does not automatically mean the system is correctly charged.
Target superheat depends on factors such as:
- equipment design;
- metering device;
- evaporator load;
- indoor air conditions;
- operating mode; and
- manufacturer specifications.
The PT chart performs the pressure-to-saturation-temperature conversion. The OEM procedure determines how the resulting superheat should be interpreted.
Which PT Value Should Be Used for Superheat?
For refrigerants with meaningful temperature glide:
Use the dew point or saturated-vapor value for superheat.
This is especially important with zeotropic refrigerant blends.
For a single-component refrigerant such as R32, there is one saturation relationship at a given pressure.
For a near-azeotropic blend such as R410A, bubble and dew values are very close.
For a zeotropic blend with meaningful glide, the distinction becomes more important.
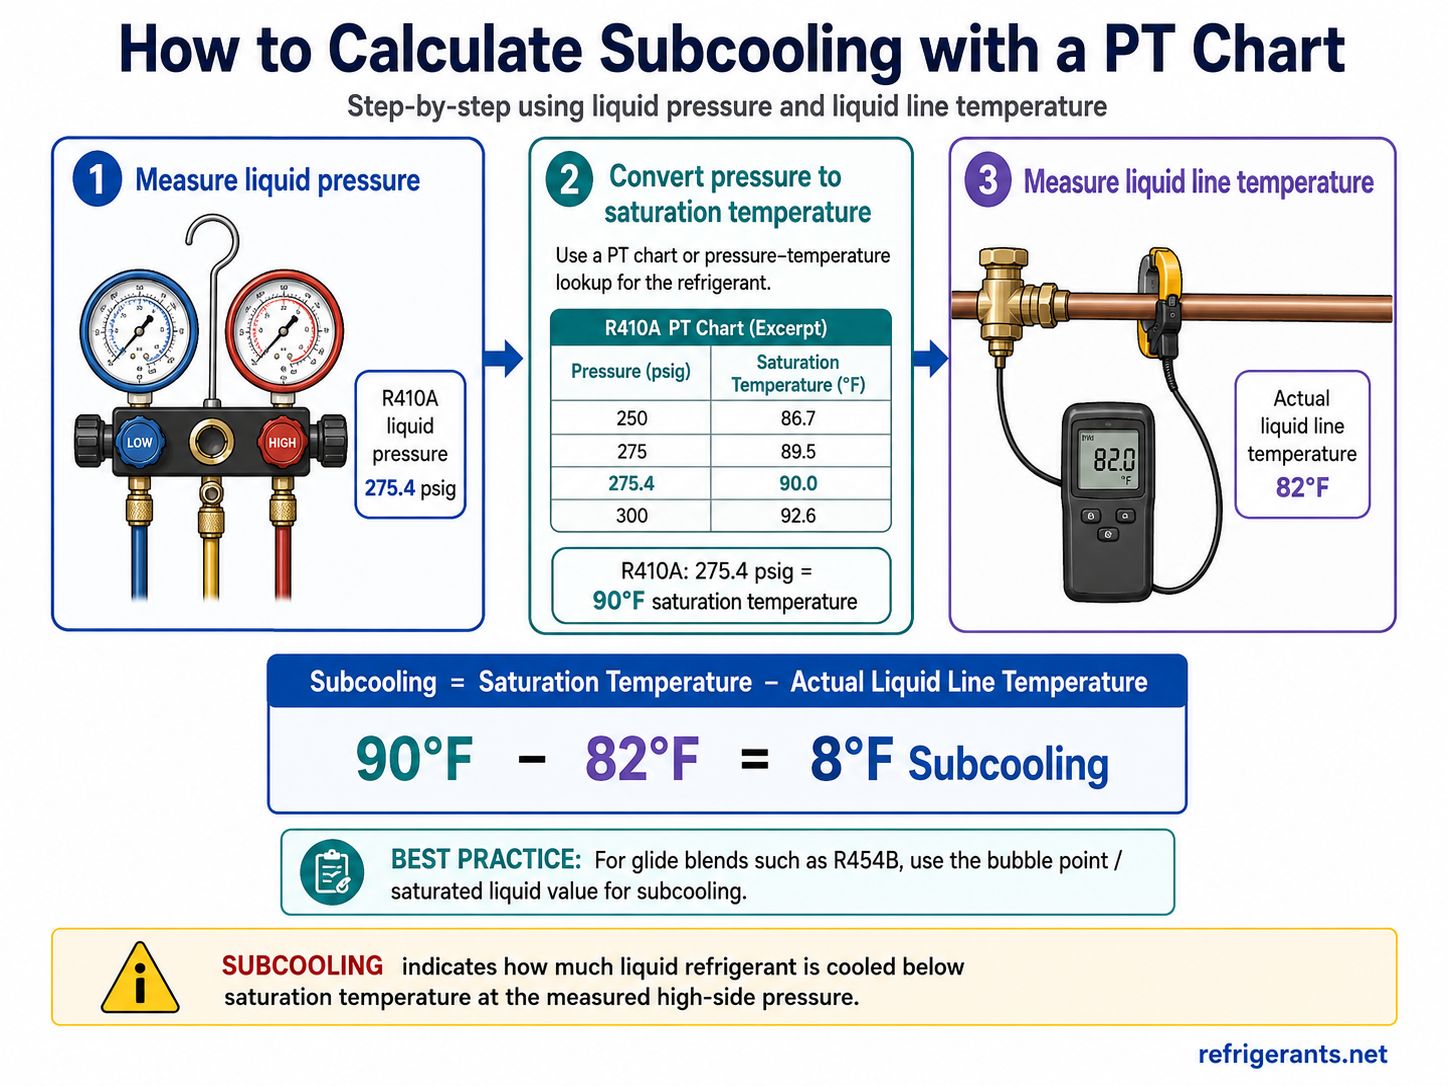
How to Calculate Subcooling with a PT Chart
Subcooling describes how far liquid refrigerant has been cooled below its saturation temperature at the measured high-side pressure.
The formula is:
Subcooling = Saturation Temperature − Actual Liquid Line Temperature
Subcooling Example
Suppose the high-side pressure in an R410A system corresponds to approximately:
90°F saturation temperature
The actual liquid-line temperature is:
82°F
The calculation is:
90°F − 82°F = 8°F subcooling
The liquid refrigerant is therefore approximately 8°F below its saturation temperature.
Again, the calculated result should be compared with the manufacturer’s target subcooling rather than treated as a universal charging specification.
Which PT Value Should Be Used for Subcooling?
For refrigerants with meaningful temperature glide:
Use the bubble point or saturated-liquid value for subcooling.
This is the opposite side of the saturation region from the value used for superheat.
A simple way to remember the rule is:
| Calculation | PT Reference |
|---|---|
| Superheat | Dew point / saturated vapor |
| Subcooling | Bubble point / saturated liquid |
Bubble Point vs Dew Point
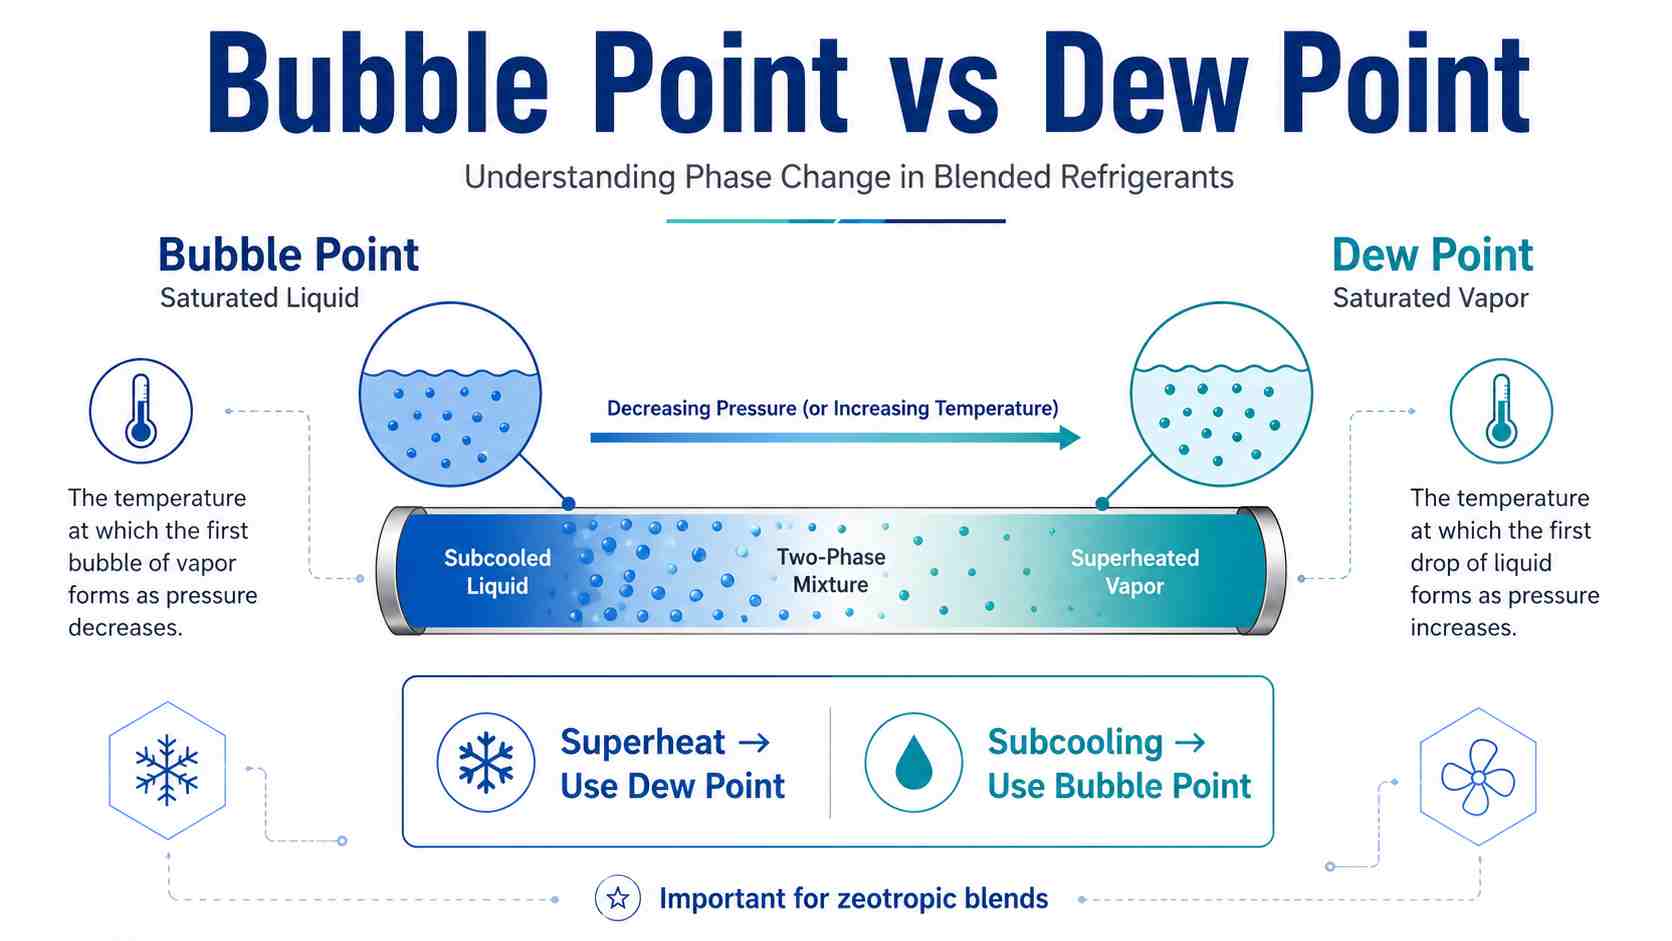
Bubble point and dew point become important when a refrigerant blend changes phase across a range of temperatures rather than at one identical saturation temperature.
What Is Bubble Point?
The bubble point represents the saturated-liquid boundary.
During evaporation, it corresponds to the condition where the first bubble of vapor begins to form from liquid.
For HVAC service calculations:
Bubble point → subcooling
What Is Dew Point?
The dew point represents the saturated-vapor boundary.
During condensation, it corresponds to the condition where the first drop of liquid begins to form from vapor.
For HVAC service calculations:
Dew point → superheat
Easy Field Reminder
Superheat → Dew
Subcooling → Bubble
This distinction matters most when working with refrigerants that have meaningful temperature glide.
What Is Refrigerant Temperature Glide?
Temperature glide is the temperature range across which a zeotropic refrigerant blend changes phase at a given pressure.
A pure refrigerant does not exhibit composition-related temperature glide during phase change.
A zeotropic blend can.
For example, R454B is an HFO/HFC zeotropic blend with an A2L safety classification. Its PT information therefore distinguishes between the saturated-liquid and saturated-vapor boundaries.
Other blends, including R407C, can show even more noticeable bubble/dew differences.
Ignoring glide can introduce an error directly into superheat or subcooling calculations.
For broader information about mildly flammable refrigerants used in modern HVAC equipment, see the A2L Refrigerants Guide.
R22 vs R410A vs R32 vs R454B PT Behavior
Different refrigerants have different pressure-temperature relationships.
That is why “What should my AC pressure be?” cannot be answered accurately without first identifying the refrigerant and operating conditions.
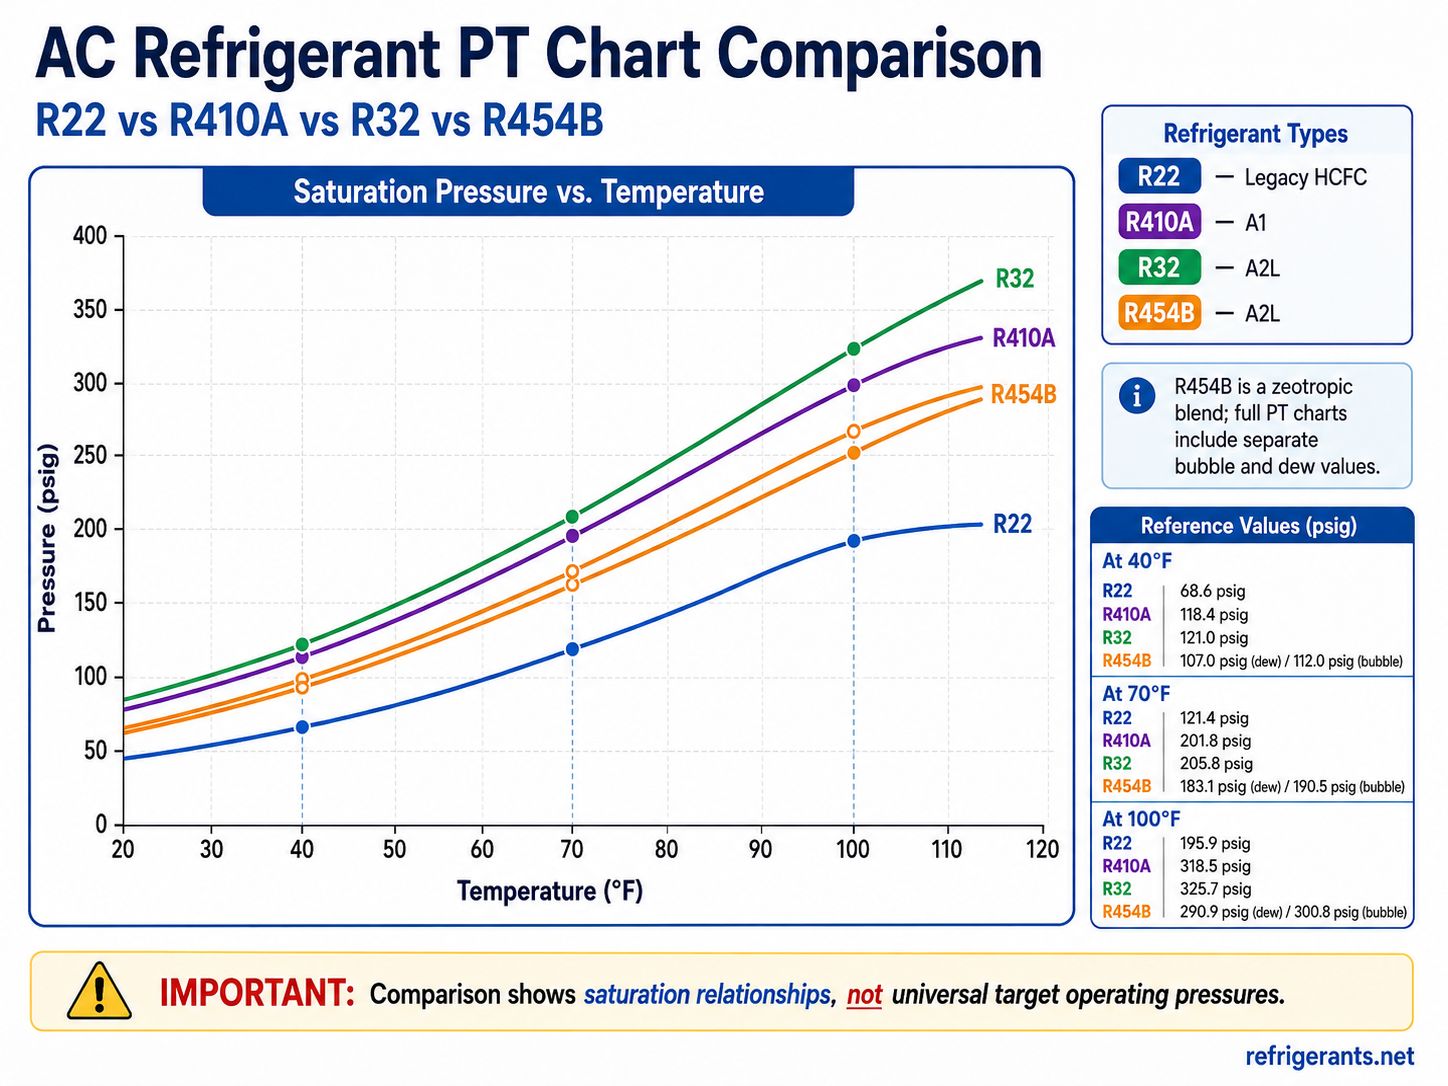
R22
R22 is a legacy HCFC refrigerant commonly associated with older air-conditioning and refrigeration equipment.
At an equivalent saturation temperature, its pressure is substantially lower than R410A-class refrigerants.
R410A
R410A is a near-azeotropic HFC blend that has been widely used in residential and light-commercial AC and heat-pump equipment.
Its operating pressure range is substantially higher than R22.
R32
R32 is a single-component HFC refrigerant with an A2L safety classification.
Its saturation pressure is generally slightly higher than R410A at the same temperature.
Because R32 is a single chemical compound rather than a refrigerant blend, there is no blend-composition temperature glide to account for.
R454B
R454B is an A2L HFO/HFC zeotropic blend increasingly associated with newer lower-GWP air-conditioning and heat-pump equipment.
Its saturation-pressure relationship is somewhat below R410A at the same temperature, and PT references may provide separate bubble and dew values.
These refrigerants are not interchangeable merely because some operate in similar pressure ranges.
Equipment design, safety classification, compressor requirements, controls, refrigerant charge and manufacturer approval must all be considered.
Can Outdoor Temperature Tell You What AC Pressure Should Be?
Not by itself.
Outdoor temperature strongly influences condenser operation and system pressure, but there is no universal equation such as:
90°F outdoor temperature = one correct AC pressure.
Actual suction and discharge pressures are influenced by many variables, including:
- outdoor ambient temperature;
- indoor return-air temperature;
- indoor humidity;
- evaporator load;
- condenser load;
- indoor airflow;
- outdoor airflow;
- refrigerant charge;
- compressor performance;
- expansion-device operation;
- equipment capacity;
- variable-speed controls;
- coil cleanliness; and
- refrigerant circuit restrictions.
Another important distinction is:
Outdoor air temperature is not the same as refrigerant saturation temperature.
A PT chart relates pressure to the refrigerant’s saturation condition, not directly to ambient air temperature.
Can a PT Chart Tell You If an AC System Is Low on Refrigerant?
No.
A PT chart alone cannot diagnose refrigerant charge.
Low suction pressure can sometimes occur with insufficient refrigerant charge, but similar pressure behavior may also result from:
- reduced evaporator airflow;
- low indoor load;
- refrigerant restrictions;
- metering-device problems;
- evaporator icing;
- compressor problems; or
- other system conditions.
Likewise, high head pressure does not automatically mean the system is overcharged.
A stronger HVAC diagnosis combines:
- suction pressure;
- discharge or liquid pressure;
- saturation temperatures;
- suction-line temperature;
- liquid-line temperature;
- superheat;
- subcooling;
- indoor and outdoor air conditions;
- airflow;
- equipment condition; and
- manufacturer specifications.
This is why a PT chart should be treated as a reference tool within a diagnostic process, not as a standalone troubleshooting answer.
Common AC PT Chart Mistakes
1. Using the Wrong Refrigerant Chart
Always confirm the exact refrigerant before interpreting pressure.
R22 pressure cannot be interpreted using an R410A PT chart, and R410A readings cannot be treated as R32 values.
2. Treating Ambient Temperature as Saturation Temperature
Outdoor temperature and refrigerant saturation temperature are different measurements.
The surrounding air affects heat exchanger performance but is not directly interchangeable with PT-chart saturation temperature.
3. Treating PT Pressure as Normal Running Pressure
A saturation-pressure reference does not define the correct suction or discharge pressure for every system.
Actual operating pressure changes with load and system conditions.
4. Confusing PSIG and PSIA
Gauge and absolute pressure use different reference points.
Make sure the tool, gauge and service data are using compatible units.
5. Using Bubble Point for Superheat
For a zeotropic refrigerant blend, superheat should use the dew-point / saturated-vapor reference.
6. Using Dew Point for Subcooling
Subcooling should use the bubble-point / saturated-liquid reference.
7. Ignoring Temperature Glide
Some blends have a meaningful difference between bubble and dew conditions.
Do not silently treat both values as identical.
8. Diagnosing Refrigerant Charge from Pressure Alone
Pressure is only one part of the system picture.
Use superheat, subcooling, temperatures, airflow and OEM service information together.
9. Assuming Similar Pressure Means Refrigerants Are Interchangeable
R410A, R32 and R454B can operate in broadly similar HVAC pressure ranges, but their composition, safety classification and equipment requirements differ.
A PT chart is not a retrofit compatibility chart.
Printed PT Chart vs Online PT Chart Tool
Traditional printed PT charts remain useful for field work because they are:
- fast;
- portable;
- available offline; and
- easy to keep with service documentation.
An online PT tool becomes especially useful when you need to:
- change refrigerants quickly;
- convert pressure to saturation temperature;
- convert temperature to saturation pressure;
- change pressure units;
- change temperature units;
- distinguish bubble and dew values; or
- check nearby reference points.
The Refrigerants.net Pressure-Temperature Chart currently provides source-controlled curves for multiple common HVAC/R refrigerants and performs lookups only within the verified embedded ranges.
The most useful workflow is therefore:
Use the tool to obtain the saturation value → use this guide to interpret the result.
AC PT Chart FAQ
What does PT mean in HVAC?
PT means pressure-temperature. A refrigerant PT chart relates saturation pressure to saturation temperature.
What is an AC PT chart?
An AC PT chart is a pressure-temperature reference used to determine the saturation pressure or saturation temperature of a refrigerant.
How do you read a refrigerant PT chart?
Identify the exact refrigerant, locate the known pressure or temperature, and read the corresponding saturation value. If pressure is being used for HVAC service calculations, the resulting saturation temperature can then be compared with actual line temperature.
What is saturation temperature?
Saturation temperature is the temperature at which refrigerant liquid and vapor can coexist at a particular pressure.
Changing pressure changes the corresponding saturation temperature.
What is the difference between suction temperature and saturation temperature?
Saturation temperature is calculated from refrigerant pressure.
Suction-line temperature is physically measured on the refrigerant line.
The difference between the actual suction-line temperature and the evaporating saturation temperature is superheat.
How do you calculate superheat with a PT chart?
Convert suction pressure into saturation temperature using the correct refrigerant PT data, measure actual suction-line temperature, then calculate:
Superheat = Suction Line Temperature − Saturation Temperature
How do you calculate subcooling with a PT chart?
Convert high-side or liquid pressure into saturation temperature, measure actual liquid-line temperature, then calculate:
Subcooling = Saturation Temperature − Liquid Line Temperature
Do I use bubble point or dew point for superheat?
For refrigerant blends with meaningful glide, use the dew point / saturated-vapor value for superheat.
Do I use bubble point or dew point for subcooling?
Use the bubble point / saturated-liquid value for subcooling.
Is an AC PT chart the same as an AC pressure chart?
Not necessarily.
A PT chart describes the refrigerant’s saturation pressure-temperature relationship.
An AC operating-pressure chart may instead show expected suction or discharge pressures under specific equipment and environmental conditions.
What pressure should an AC system run at?
There is no universal AC pressure.
Correct operating pressure depends on the refrigerant, system design, evaporating and condensing conditions, indoor and outdoor load, airflow and equipment controls.
Does R32 have higher pressure than R410A?
At the same saturation temperature, R32 pressure is generally slightly higher than R410A.
The exact value depends on temperature and the thermodynamic dataset being used.
Is R454B pressure the same as R410A?
No.
R454B operates in a broadly similar HVAC pressure range but has a different pressure-temperature relationship. It is also a zeotropic A2L blend, so bubble and dew conditions must be considered.
Can a PT chart tell me the correct refrigerant charge?
No.
A PT chart is a thermodynamic saturation reference. Correct charging must follow the equipment manufacturer’s specified method, operating conditions and target values.
Where can I find an exact refrigerant pressure or saturation temperature?
Use the Refrigerants.net Pressure-Temperature Chart Tool to perform temperature-to-pressure or pressure-to-temperature lookups for supported refrigerants.
Final Takeaway
An AC PT chart is most useful when you understand that it is a saturation reference rather than a universal operating-pressure specification.
The practical workflow is:
Identify the refrigerant → measure pressure → convert pressure to saturation temperature → select bubble or dew when required → measure actual line temperature → calculate superheat or subcooling → compare the result with OEM service specifications.
For exact PT lookups, use the Refrigerant Pressure-Temperature Chart Tool.
For deeper refrigerant information, continue with:
Technical note: Refrigerant P-T values can vary slightly between reputable property datasets because of equations of state, source tables and rounding. For numerical lookups on Refrigerants.net, use the source-controlled dataset embedded in the P-T Chart Tool and follow current equipment manufacturer documentation for real-system service decisions.
